Using the Inspect Element tool is essential for web developers, designers, and digital marketers alike. It allows you to examine the structure and elements of a webpage, making it easier to debug issues, analyze website performance, and understand how different elements are rendered. This guide will walk you through how to use Inspect Element in Chrome, Safari, and Firefox, with a focus on the key features and functionalities that can aid in examining elements related to referrerAdCreative.
Accessing Inspect Element
Each browser has a slightly different method to access the Inspect Element feature. Here’s how to do it in Chrome, Safari, and Firefox:
| Browser | How to Access Inspect Element |
|---|---|
| Chrome | Right-click on any element on the page and select "Inspect" or press Ctrl + Shift + I (Windows) or Cmd + Option + I (Mac). |
| Safari | Enable the "Develop" menu in preferences, then right-click on any element and select "Inspect Element" or press Cmd + Option + I. |
| Firefox | Right-click on any element and choose "Inspect" or press Ctrl + Shift + I (Windows) or Cmd + Option + I (Mac). |
Understanding the Inspect Element Interface
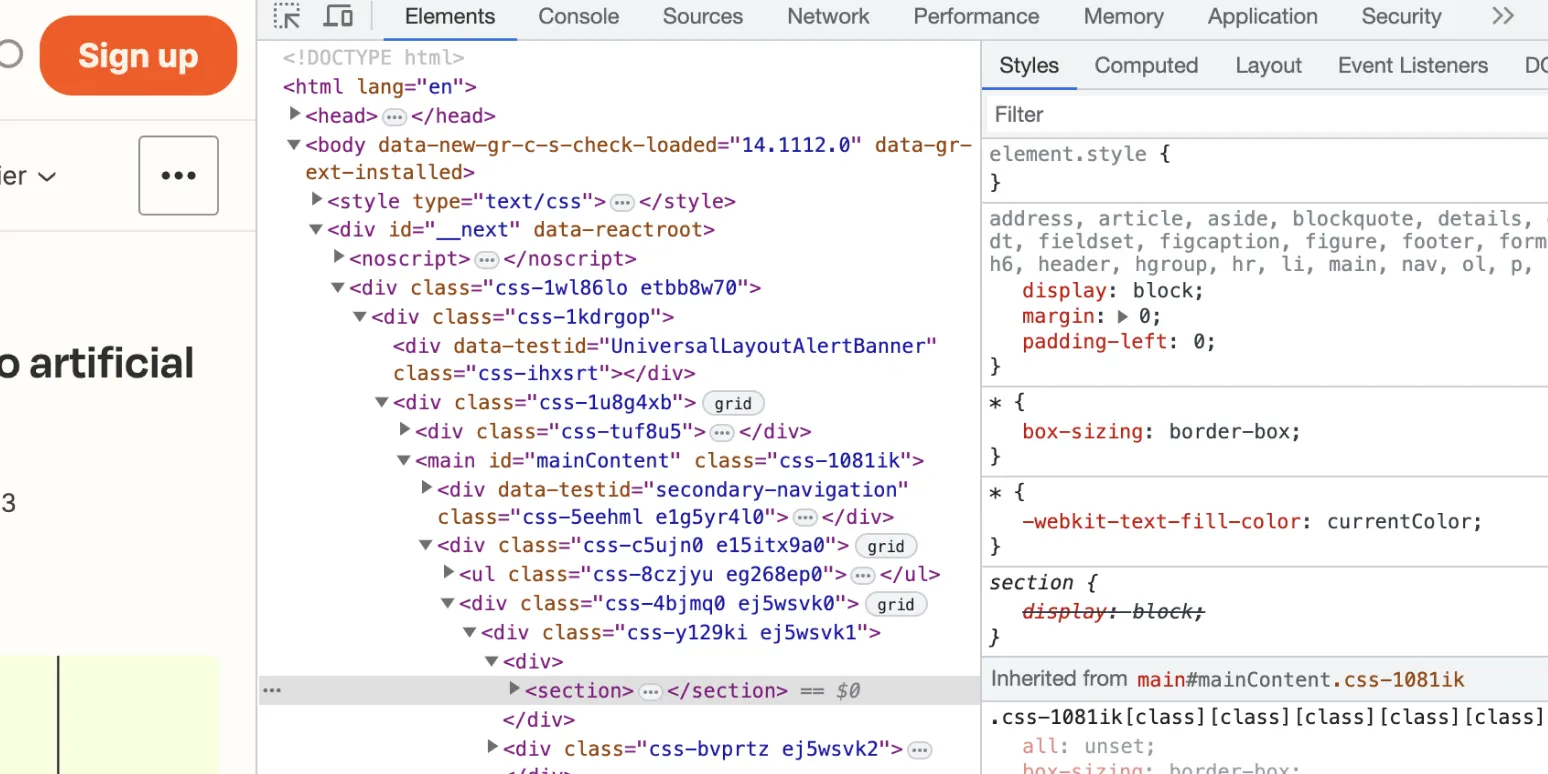
Once you’ve opened the Inspect Element tool, you will see a panel that displays various tabs, typically including "Elements," "Console," "Network," "Performance," and more. Each tab serves a unique purpose, so let’s break them down:
Elements Tab
The Elements tab shows the HTML structure of the webpage. You can hover over different elements in the HTML code, and the corresponding part of the webpage will be highlighted. This is particularly useful for identifying the referrerAdCreative elements and understanding their hierarchy.
Styles Pane
When you click on an HTML element, the Styles pane on the right side shows the CSS rules applied to that element. You can edit these styles in real-time to see how changes affect the appearance of the referrerAdCreative elements. This feature is invaluable for A/B testing and design adjustments.
Console Tab
The Console tab allows you to execute JavaScript code directly in the context of the webpage. This can be useful for debugging scripts or manipulating elements dynamically. You can inspect the console output to see how the referrerAdCreative scripts are behaving.
Network Tab
The Network tab tracks all network requests made by the webpage. This is particularly helpful for analyzing how the referrerAdCreative content is loaded. You can see the timing, size, and response of each request, providing insights into performance optimization.
Using Inspect Element for Referrer Ad Creative Analysis
Analyzing referrerAdCreative using Inspect Element can provide you with crucial data on how ads are displayed and interacted with on your website. Here’s how you can utilize the Inspect Element tool effectively:
Identifying Ad Elements
Navigate to the Elements tab and search for specific ad-related HTML tags, such as <div>, <img>, or any custom tags used for displaying ads. You can quickly identify which elements correspond to your referrerAdCreative.
Evaluating Ad Performance
Utilize the Network tab to observe how quickly your referrerAdCreative loads. Look for any slow-loading scripts or images that could impact user experience. By analyzing the load times and response codes, you can pinpoint areas for improvement.
Testing Different Scenarios
Use the Console tab to test different scenarios with your referrerAdCreative. For instance, you might want to simulate user interactions or test how different styles affect the ad display. You can input JavaScript to manipulate the DOM and see changes in real-time.
Best Practices for Using Inspect Element
Here are some best practices to keep in mind while using Inspect Element:
- Use Responsively: Always check how your referrerAdCreative appears on different screen sizes by resizing the Inspect Element panel.
- Make Temporary Changes: Remember that any changes you make are temporary and only affect your local view of the webpage. Use these changes for testing, but not for permanent fixes.
- Learn and Experiment: Don’t hesitate to explore different tabs and features within the Inspect Element tool. It’s a powerful way to learn about web development and design.
In conclusion, mastering the Inspect Element tool in Chrome, Safari, and Firefox can significantly enhance your ability to analyze and optimize referrerAdCreative. By understanding how to access it and utilize its various features, you can improve your website's performance and user experience effectively.


