

Creating a flowchart in Excel can be a straightforward process that enhances your data visualization skills. Whether you're looking to illustrate a process, outline a project, or present data in a clear format, Excel offers robust tools to help you achieve your goals. In this guide, we'll explore how to create a flowchart in Excel, complete with a downloadable template, ensuring you can effectively communicate your ideas using this versatile software.
Understanding Flowcharts
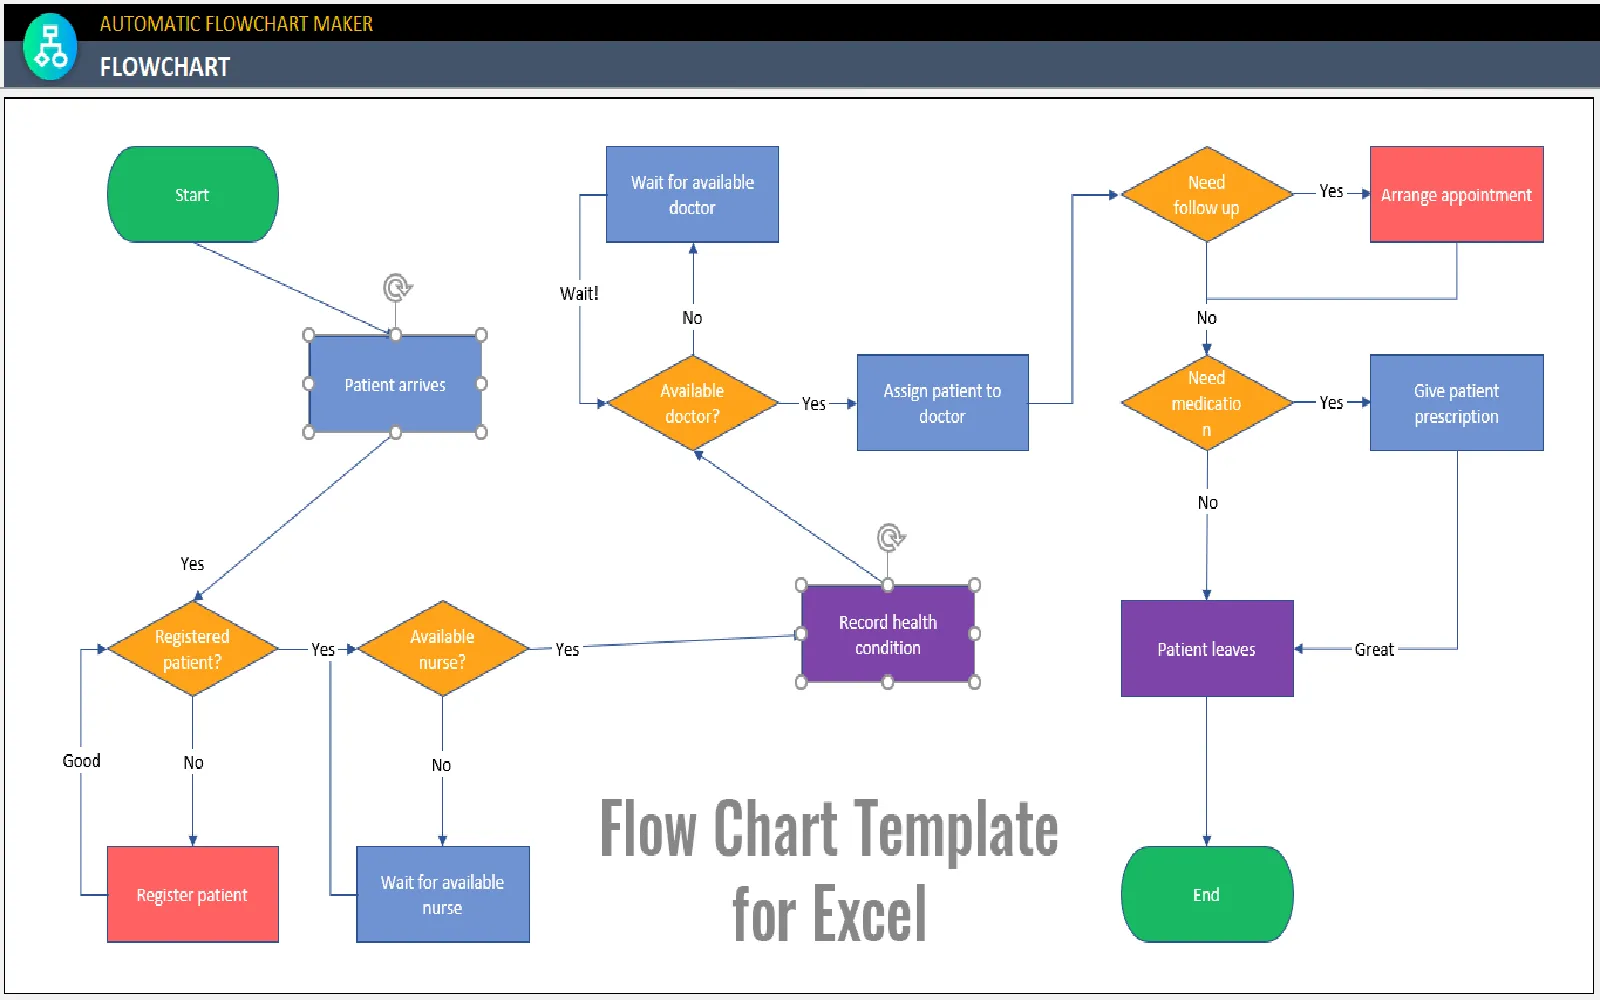
Before diving into the specifics of creating a flowchart in Excel, it's essential to grasp what a flowchart is. A flowchart is a diagram that represents a process or workflow. It uses various symbols to denote different steps, making it easy for viewers to understand the sequence of actions. Commonly used in business settings, flowcharts help streamline processes and clarify complex information.
Getting Started: Preparing Your Excel Sheet
To create a flowchart in Excel, start by opening a new workbook. This clean slate will help you organize your flowchart effectively. Here are the steps to begin:
Open Microsoft Excel and create a new workbook.
Adjust the column widths and row heights to create a grid layout that suits your flowchart design.
Ensure you have enough space for your flowchart elements.
Accessing Shapes for Your Flowchart
Excel has a built-in feature that allows you to add shapes, which are essential for creating flowcharts. To access shapes:
Go to the Insert tab on the ribbon.
Click on Shapes to see a drop-down menu of various shapes.
Select the shapes you want to use for your flowchart, such as rectangles for processes, diamonds for decisions, and arrows for flow direction.
Designing Your Flowchart
Now that you have your shapes, it’s time to design your flowchart. Follow these tips to create an organized and visually appealing flowchart:
Drag and drop shapes onto the Excel worksheet to represent different steps in the process.
Use Connectors to link the shapes. These connectors will show the direction of the flow, making it easier for viewers to follow.
Add text to each shape by double-clicking on it. Clearly label each step or decision point.
Utilize colors and styles to differentiate between various types of actions or groups in your flowchart.
Adding Text and Labels
Text plays a crucial role in flowcharts as it provides context to each step. When adding text, keep the following in mind:
Be concise. Use short phrases that clearly describe each action.
Ensure that the font size is readable. Typically, a size of 12-14 points works well for flowcharts.
Consider using bold text for key actions or decisions to catch the viewer's attention.
Saving and Sharing Your Flowchart
Once your flowchart is complete, saving it properly is essential for future reference or sharing. Here are some options:
Save your Excel workbook as a standard .xlsx file for easy editing later.
To share your flowchart, consider exporting it as a PDF. This format preserves the layout and makes it easy to share with colleagues.
If you want to use your flowchart in presentations, you can copy and paste it into PowerPoint.
Using a Flowchart Template in Excel
If you're short on time or unsure where to start, using a flowchart template can be incredibly helpful. Many templates are available online, including those that integrate with Excel. Here are some advantages of using a template:
Pre-designed layouts save you time and effort.
Templates often come with built-in formatting, ensuring a professional look.
They can serve as a great starting point, allowing you to customize based on your specific needs.
Conclusion
Creating a flowchart in Excel is a valuable skill that can help streamline your projects and enhance communication within your team. By following this guide, you can effectively design your flowchart using various shapes, connectors, and text elements. Remember to utilize templates if you need extra assistance or inspiration. With practice, your flowcharts will not only convey information clearly but also engage your audience. Whether you're working on a project plan, a process analysis, or any other task that requires visual representation, mastering flowcharts in Excel is a step towards better data management and presentation.


