Discover Best AI Tools for Automated Data Exploration

4.5
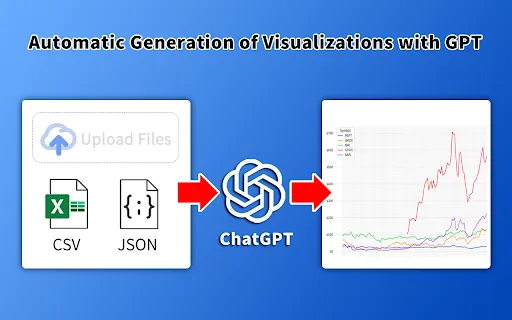
GPT Spreadsheets Visualization is a powerful tool designed to enhance the way users interact with data in spreadsheets. By leveraging advanced AI capabilities, it allows users to create dynamic visual representations of their data, making it easier to identify trends and insights. This tool simplifies complex data analysis, enabling even those without extensive technical knowledge to harness the power of data visualization.With an intuitive interface, GPT Spreadsheets Visualization integrates seamlessly with existing spreadsheet applications, providing users with various visualization options such as charts and graphs. Its AI-driven features can automatically suggest the most suitable visual formats based on the data, ensuring that users can effectively communicate their findings. This tool aims to empower individuals and teams by transforming raw data into compelling visual narratives that facilitate better decision-making.
Automated Data Exploration