1. First Response Time (FRT)
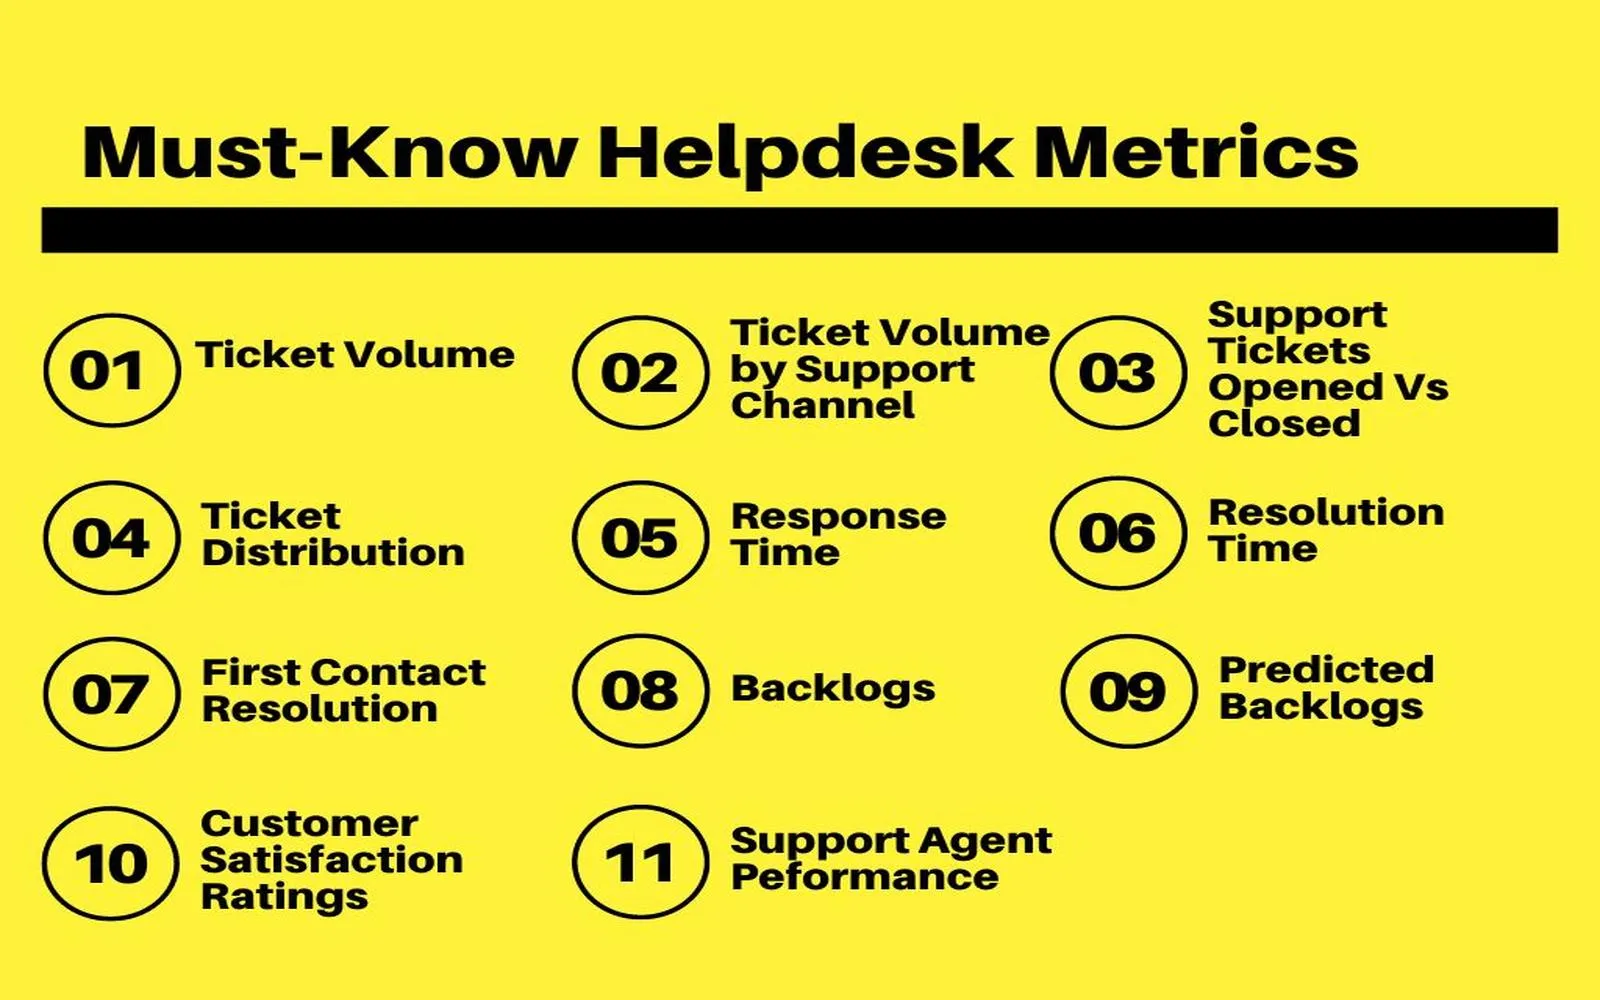
First Response Time is a crucial metric that measures how long it takes for customer support to respond to a customer inquiry. A shorter FRT often leads to higher customer satisfaction. Companies should aim for an FRT of under 1 hour, especially for urgent issues. Tracking this metric helps support teams identify areas for improvement and streamline response processes.
2. Resolution Time
Resolution Time measures the amount of time it takes to resolve a customer issue from the moment it is reported. This metric is essential for understanding how efficiently your support team handles inquiries. A quicker resolution time not only improves customer satisfaction but also decreases the volume of repeat inquiries. Analyzing this metric can highlight bottlenecks in the support process.
3. Customer Satisfaction Score (CSAT)
Customer Satisfaction Score is a direct measure of how satisfied customers are with your support services. Typically measured through post-interaction surveys, CSAT helps gauge the effectiveness of your support team. A higher CSAT indicates that your support is meeting customer needs effectively. Regularly reviewing CSAT scores allows businesses to adapt and enhance their support strategies.
4. Net Promoter Score (NPS)
Net Promoter Score is a metric that evaluates customer loyalty and the likelihood of customers to recommend your services to others. It is derived from a single-question survey that asks customers how likely they are to recommend your product. A high NPS indicates strong customer loyalty, while a low score can signal the need for improvements in customer support. Monitoring NPS can guide strategic decisions in customer service enhancements.
5. Ticket Volume
Ticket Volume refers to the number of support requests received over a specific period. Monitoring this metric helps assess the overall demand for customer support and can indicate trends in customer behavior. An increase in ticket volume may suggest issues with a product or service that need addressing. Understanding ticket volume trends allows businesses to allocate resources effectively and prepare for peak periods.
6. First Contact Resolution (FCR)
First Contact Resolution measures the percentage of customer inquiries that are resolved on the first interaction. A high FCR rate indicates that your support team is effective at addressing customer issues without the need for follow-up contacts. This metric is vital for improving customer satisfaction and reducing operational costs. Regularly analyzing FCR can help identify training needs for support agents.
7. Agent Utilization Rate
Agent Utilization Rate measures the percentage of time that support agents are actively engaged in handling customer inquiries compared to their total available working hours. High utilization rates are essential for maximizing efficiency and productivity. However, it’s crucial to balance utilization with agent burnout to maintain team morale. Tracking this metric can guide staffing decisions and training initiatives.
8. Escalation Rate
Escalation Rate tracks the percentage of support tickets that require escalation to higher-level support teams. A high escalation rate may indicate that frontline agents lack the necessary training or resources to resolve issues independently. Reducing the escalation rate can lead to faster resolutions and improved customer satisfaction. Regularly analyzing this metric helps identify areas where additional training may be needed.
9. Customer Effort Score (CES)
Customer Effort Score gauges how easy or difficult it is for customers to resolve their issues with your support team. This metric is crucial because it directly correlates with customer loyalty. A lower CES indicates that customers find it easy to get their issues resolved, leading to higher retention rates. Tracking CES helps businesses streamline processes and enhance the overall customer experience.
Conclusion
Understanding and monitoring these help desk metrics can significantly enhance your customer support strategy. By focusing on First Response Time, Resolution Time, Customer Satisfaction Score, Net Promoter Score, Ticket Volume, First Contact Resolution, Agent Utilization Rate, Escalation Rate, and Customer Effort Score, businesses can create a more efficient and customer-centric support system. Implementing these metrics will not only improve customer satisfaction but also contribute to the overall success of your organization.
Chart: Help Desk Metrics Overview
| Metric | Description | Importance |
|---|---|---|
| First Response Time | Time taken to respond to a customer inquiry | Higher satisfaction |
| Resolution Time | Time taken to resolve a customer issue | Improves efficiency |
| Customer Satisfaction Score | Measures customer satisfaction post-interaction | Gauge effectiveness |
| Net Promoter Score | Measures customer loyalty and recommendations | Strategic insights |
| Ticket Volume | Total number of support requests | Assesses demand |
| First Contact Resolution | Percentage of issues resolved on first contact | Enhances customer experience |
| Agent Utilization Rate | Time agents are actively engaged with customers | Maximizes productivity |
| Escalation Rate | Percentage of tickets escalated to higher support levels | Identifies training needs |
| Customer Effort Score | Measures ease of issue resolution for customers | Improves retention |


