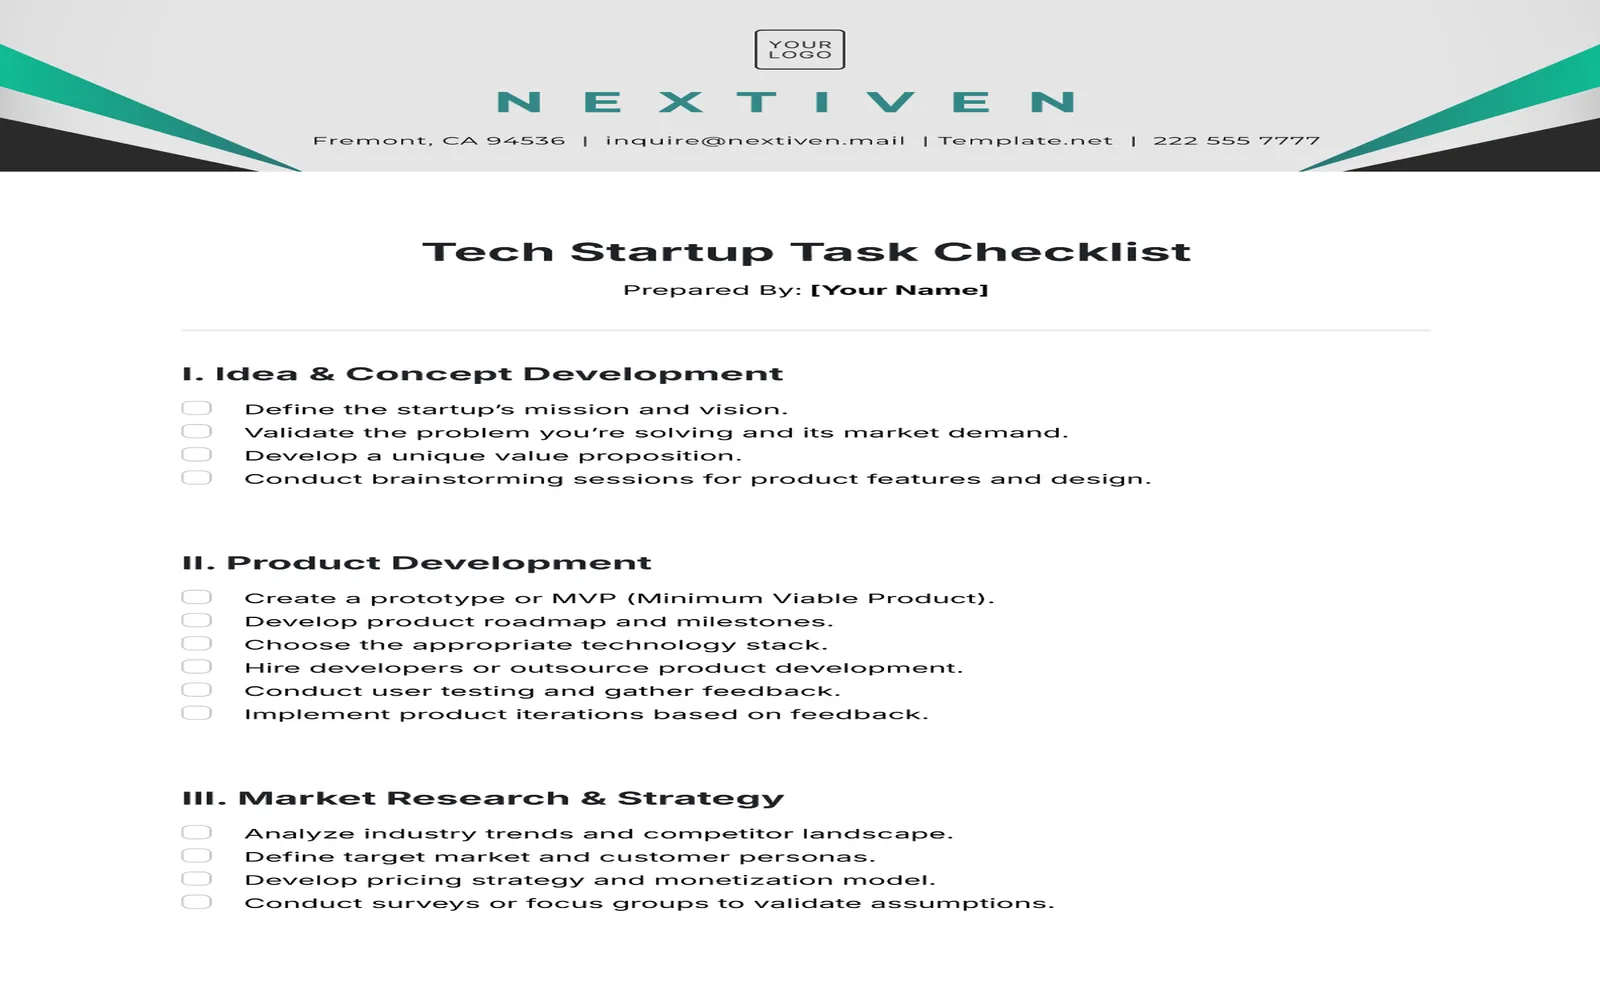
Sales forecasting is an essential aspect of business planning, helping organizations predict future sales and make informed decisions. Using spreadsheets can simplify this process, offering a structured way to analyze data. Here are the five sales forecasting spreadsheets you really need to enhance your forecasting accuracy and efficiency.
1. Basic Sales Forecasting Template
The Basic Sales Forecasting Template is a straightforward tool designed for small businesses or startups. This spreadsheet allows you to input historical sales data, which the template uses to project future sales based on trends. With this simple format, you can create forecasts on a monthly or quarterly basis.
The key features of this template include:
- Input fields for past sales data
- Automatic calculations for average monthly sales
- Visual charts to represent sales trends
This template is ideal for businesses looking to get a quick overview of their sales trajectory without complex calculations.
2. Moving Average Sales Forecasting Spreadsheet
The Moving Average Sales Forecasting Spreadsheet is perfect for businesses that experience seasonal fluctuations in sales. By averaging sales over a specified period, this spreadsheet helps smooth out the volatility and provides a clearer picture of future sales trends.
Key features include:
- Dynamic calculation of moving averages
- Customizable periods for averaging (e.g., 3-month, 6-month)
- Graphical representation of moving averages versus actual sales
This tool is invaluable for businesses that need to account for seasonal variations when planning their inventory and marketing strategies.
3. Sales Forecasting with Pipeline Analysis
This spreadsheet integrates sales pipeline data, allowing you to forecast future sales based on your current leads and opportunities. By analyzing the stages of your sales pipeline, you can predict the likelihood of closing deals and generate a more accurate sales forecast.
Essential features include:
- Input fields for potential deals at various stages
- Probability weighting for each stage of the sales process
- Visual representation of pipeline status
This spreadsheet is crucial for sales teams focused on lead conversion and optimizing their sales strategies.
4. Yearly Sales Forecasting Spreadsheet
The Yearly Sales Forecasting Spreadsheet provides a long-term view of your sales projections. This tool is particularly useful for strategic planning and budgeting, as it allows businesses to set annual targets based on historical data and market trends.
Key features include:
- Year-on-year comparison of sales data
- Input fields for anticipated market changes
- Visual charts illustrating year-over-year growth
This spreadsheet is indispensable for organizations that aim to align their resources and strategies with long-term sales goals.
5. Sales Forecasting Dashboard
The Sales Forecasting Dashboard is an advanced tool that consolidates multiple data sources into a single interface. This dashboard provides real-time insights and visualizations, making it easier to track your sales forecasts against actual performance.
Features of this dashboard include:
- Integration with CRM systems for real-time data updates
- Customizable KPIs to track sales performance
- Interactive charts and graphs for quick analysis
This tool is ideal for sales managers and executives who require detailed insights and data-driven decision-making capabilities.
In conclusion, utilizing these five essential sales forecasting spreadsheets can significantly enhance your forecasting accuracy and overall sales strategy. Whether you are a small business owner looking for a basic template or a sales manager needing an advanced dashboard, these spreadsheets cater to various needs and complexities. By incorporating these tools into your sales planning process, you can make informed decisions that drive growth and success.
Investing time in mastering these spreadsheets will pay off in the long run, providing you with the necessary insights to optimize your sales efforts and achieve your business goals.


