

 Open site
 4.6
Introduction:
ChartAI is an innovative platform designed to simplify data visualization through the power of artificial intelligence. It enables users to convert complex data sets into clear, actionable insights, making it easier to understand trends and patterns without requiring extensive technical expertise. The platform is particularly beneficial for businesses and individuals who seek to make data-driven decisions efficiently.With its user-friendly interface, ChartAI allows users to create stunning visualizations quickly and intuitively. By leveraging advanced algorithms, it automates the charting process, ensuring that users can focus on analysis rather than grappling with data manipulation. Whether you are a seasoned analyst or a newcomer to data science, ChartAI provides the tools necessary to transform your data storytelling capabilities. 
Monthly Visitors:
 31.8K
31.8K
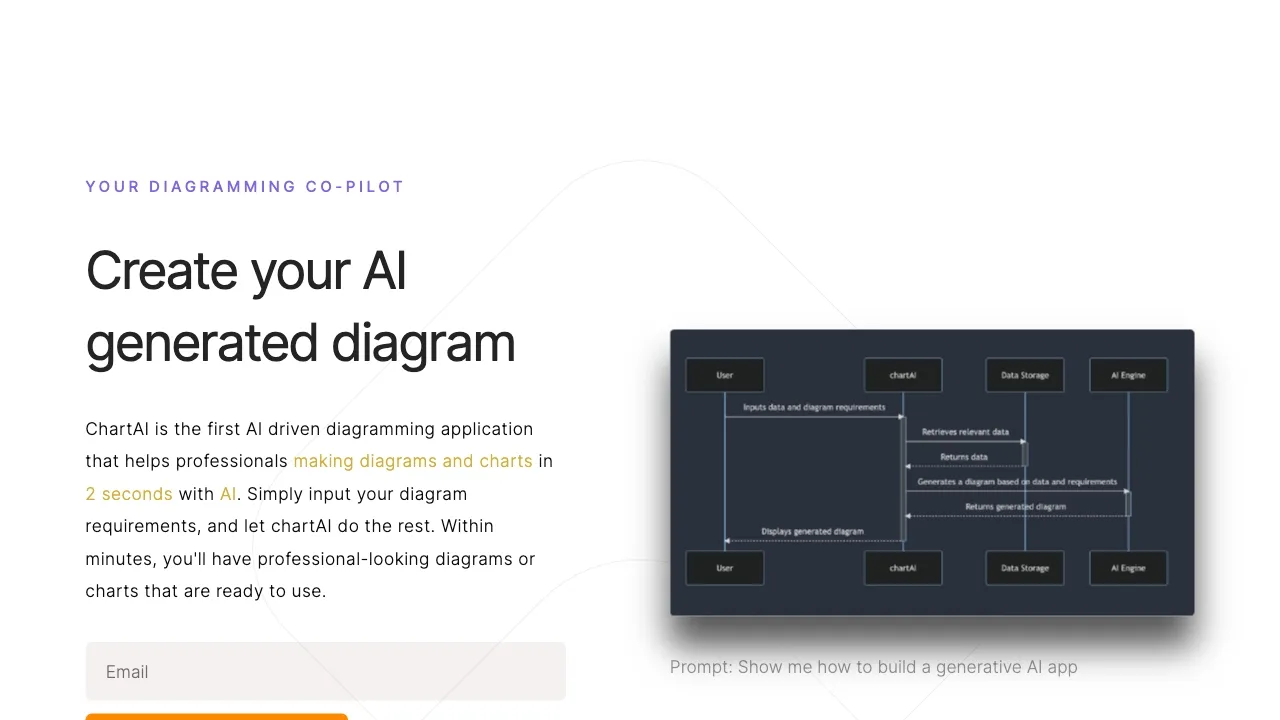
ChartAI is an innovative platform designed to empower users with advanced data visualization and analysis capabilities. By leveraging cutting-edge artificial intelligence technology, it simplifies the process of transforming complex datasets into insightful charts and graphs. This user-friendly tool caters to a wide range of industries, enabling businesses, researchers, and individuals to make data-driven decisions effortlessly.
With ChartAI, users can easily create stunning visual representations of their data without requiring extensive technical expertise. The platform offers a variety of customizable templates, allowing for personalized presentations that effectively communicate insights. By harnessing the power of AI, ChartAI not only enhances productivity but also fosters informed decision-making, making it an essential resource for anyone looking to unlock the full potential of their data.
 ChartAI offers intuitive data visualization tools that simplify complex datasets, making it easier for users to interpret and present their findings. This user-friendly interface allows individuals with minimal technical expertise to create compelling charts and graphs, enhancing their ability to communicate insights effectively. The platform supports real-time collaboration, enabling teams to work together seamlessly on data analysis projects. This feature fosters a collaborative environment, ensuring that diverse perspectives are incorporated into decision-making processes and improving overall project outcomes. ChartAI is equipped with advanced analytics capabilities, allowing users to derive deeper insights from their data. By leveraging machine learning algorithms, the platform can identify trends and patterns that might be overlooked, empowering users to make data-driven decisions with greater confidence and accuracy.
 ChartAI may have limitations in data accuracy, as it relies on the quality of the input data. If the data is flawed or biased, the generated charts could misrepresent the information, leading to incorrect interpretations and decisions. Another drawback is the potential lack of customization. Users might find that the tool offers limited options for tailoring visualizations to specific needs, making it difficult to create more nuanced or visually appealing charts that align with individual preferences. Additionally, ChartAI might require a learning curve for users unfamiliar with AI tools or data visualization. This could hinder adoption for those who need a more intuitive interface or straightforward functionality, resulting in frustration and decreased productivity.
#1
ChartAI can be used in a variety of scenarios such as business presentations, academic research, data analysis, and educational purposes to create visually compelling representations of information or data.ChartAI is an impressive tool that simplifies data visualization with its intuitive interface and powerful analytics capabilities. It enables users to create stunning charts and graphs effortlessly, making data interpretation accessible for everyone. The AI-driven insights enhance decision-making processes, and the integration with various data sources is seamless. Overall, ChartAI is a valuable asset for anyone looking to elevate their data presentation and analysis.
558.2K
 4.8
4.8
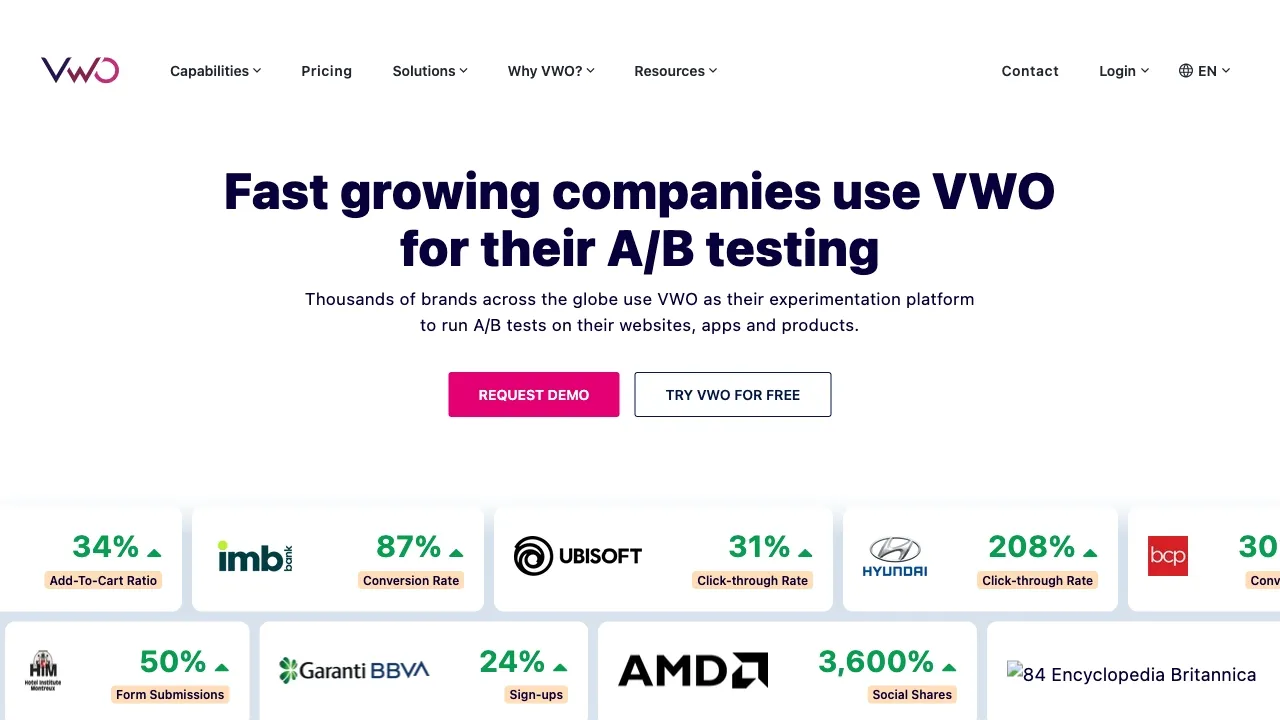
VWO, or Visual Website Optimizer, is a comprehensive platform designed to enhance online marketing efforts through effective conversion rate optimization. It empowers businesses to test, analyze, and improve their websites by providing tools for A/B testing, multivariate testing, and split URL testing. By enabling users to understand visitor behavior and preferences, VWO helps organizations make data-driven decisions to boost user engagement and drive conversions.The platform also offers features like heatmaps, session recordings, and surveys, allowing marketers to gain deeper insights into how users interact with their sites. With a focus on simplifying the optimization process, VWO caters to businesses of all sizes, providing them with the tools needed to create personalized and effective online experiences. This ultimately leads to improved customer satisfaction and increased revenue.
AI Charting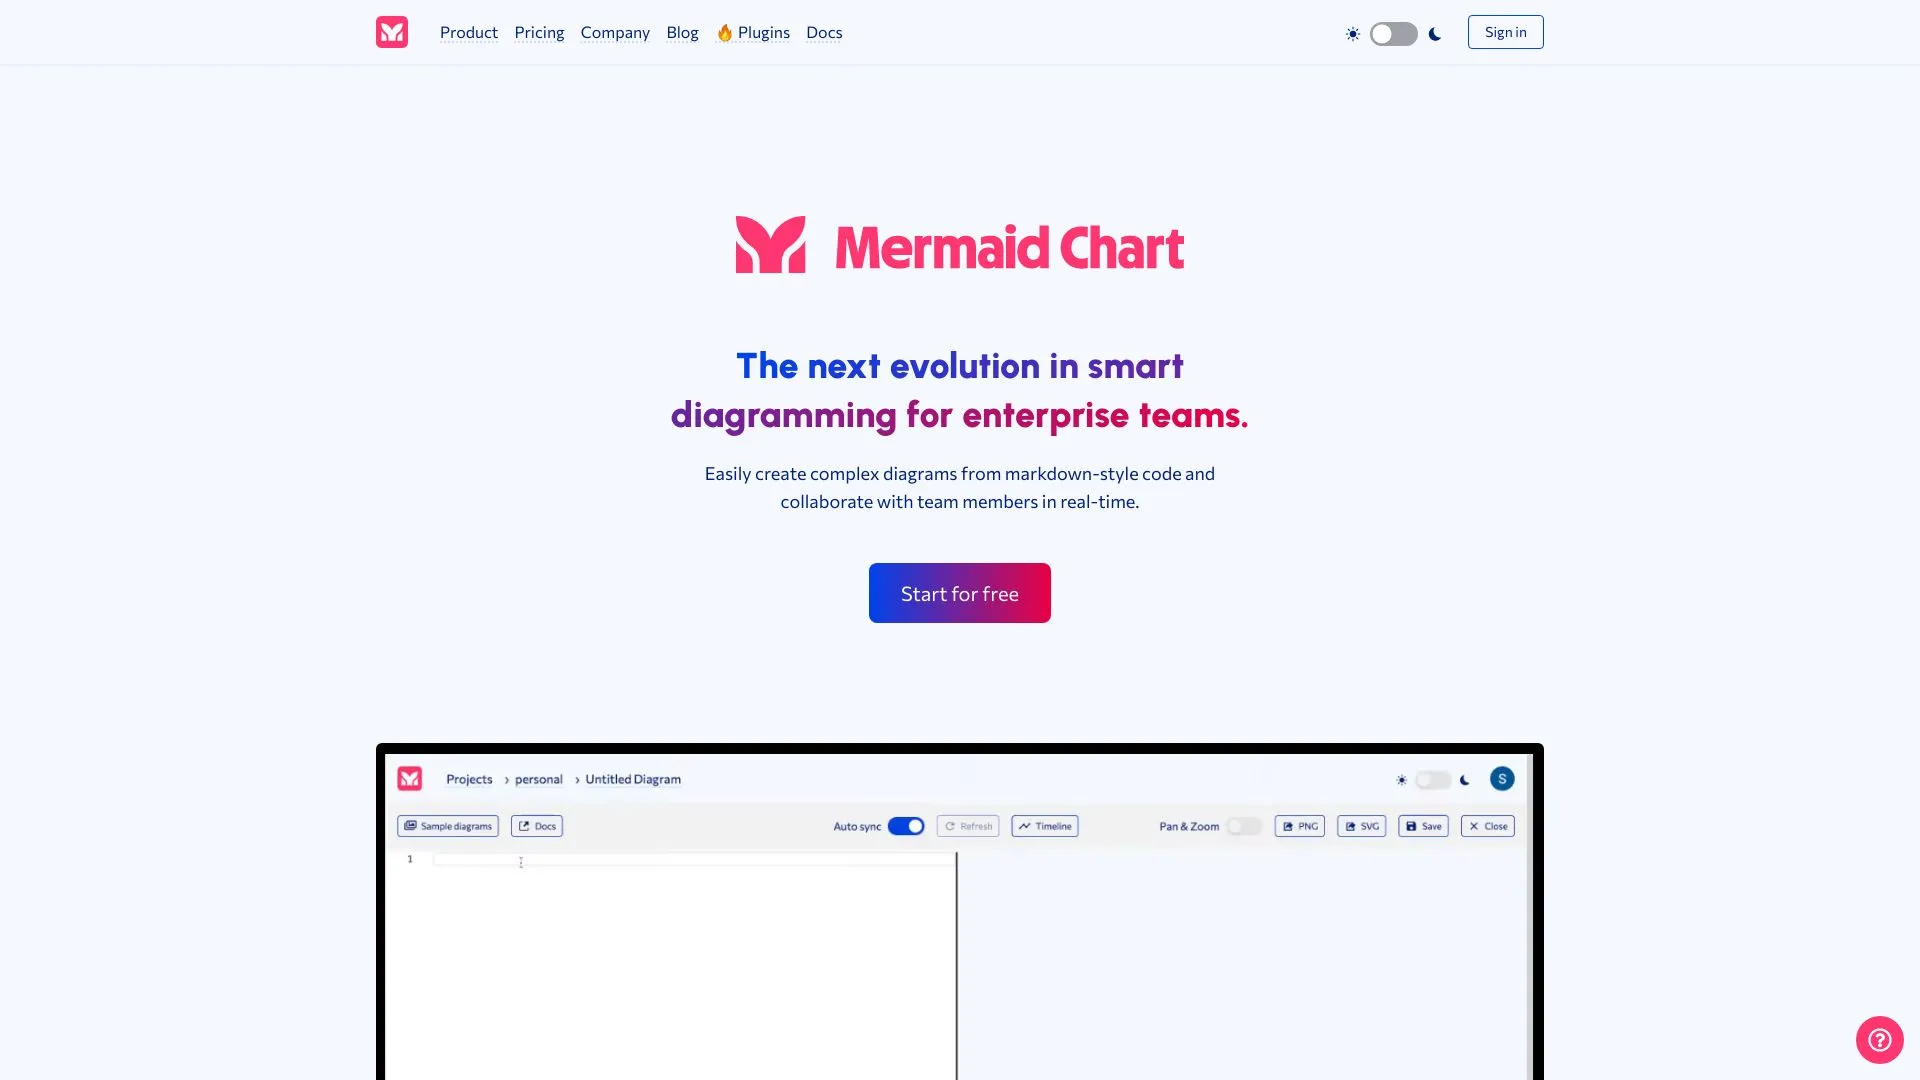
557.7K
4.5
Mermaid Chart is a powerful tool designed to simplify the creation of diagrams and visual representations directly from text. By using a simple, Markdown-inspired syntax, users can generate a variety of charts, including flowcharts, sequence diagrams, Gantt charts, and more. This text-to-diagram approach allows for easy integration into documentation, making it an ideal choice for developers, project managers, and anyone looking to visualize complex information quickly.The platform emphasizes clarity and efficiency, enabling users to focus on the content rather than the intricacies of graphic design. With Mermaid Chart, collaboration becomes seamless, as team members can easily share and modify diagrams in a collaborative environment. Its versatility and user-friendly nature make it a valuable asset for enhancing communication and understanding in both technical and non-technical contexts.
AI Charting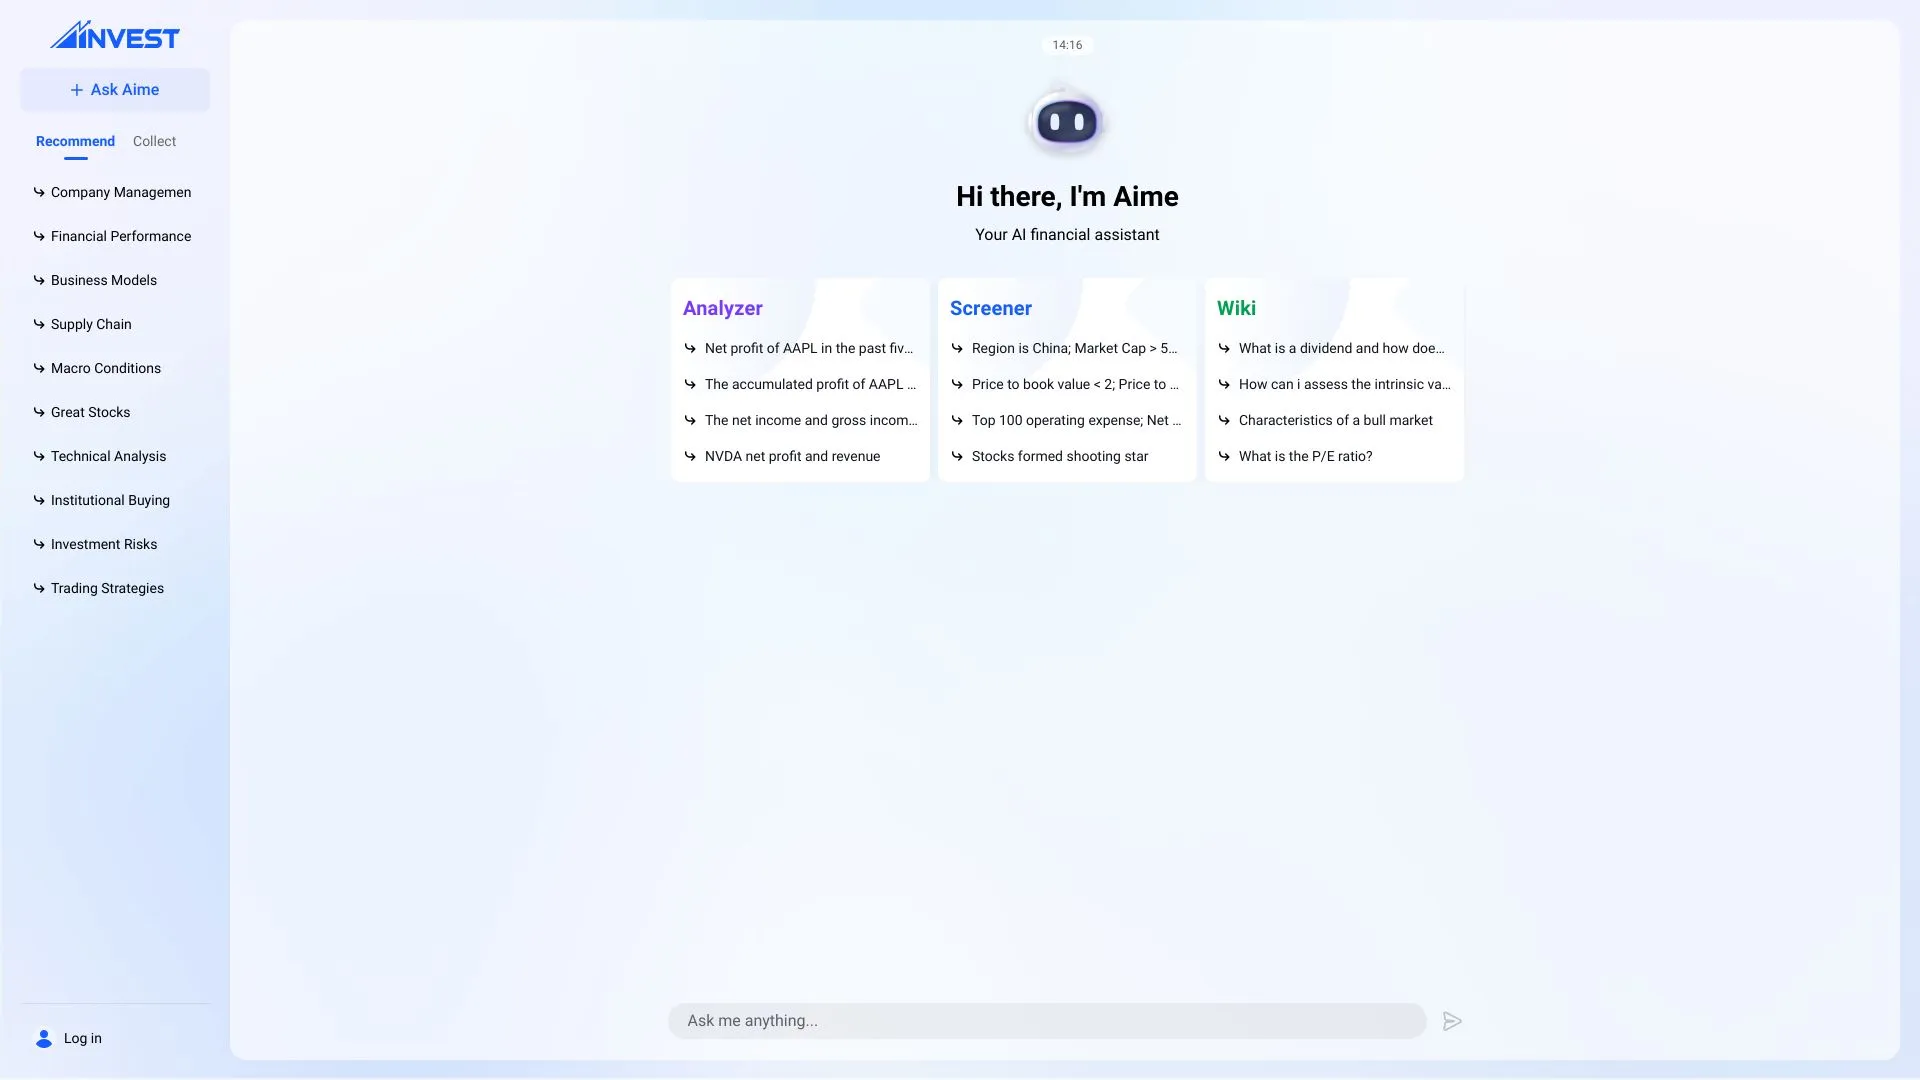
488.7K
4.5
Aime is a forward-thinking investment platform designed to empower individuals with the tools and resources needed to make informed financial decisions. By combining innovative technology with a user-friendly interface, Aime aims to simplify the investment process for both novice and experienced investors. The platform offers a range of investment options, allowing users to build and manage their portfolios effectively.At the core of Aime's mission is the belief that everyone should have access to quality investment opportunities. The platform provides educational resources, market insights, and personalized support to guide users through their investment journey. With a commitment to transparency and user satisfaction, Aime strives to create a more inclusive financial landscape, helping individuals achieve their financial goals.
AI Charting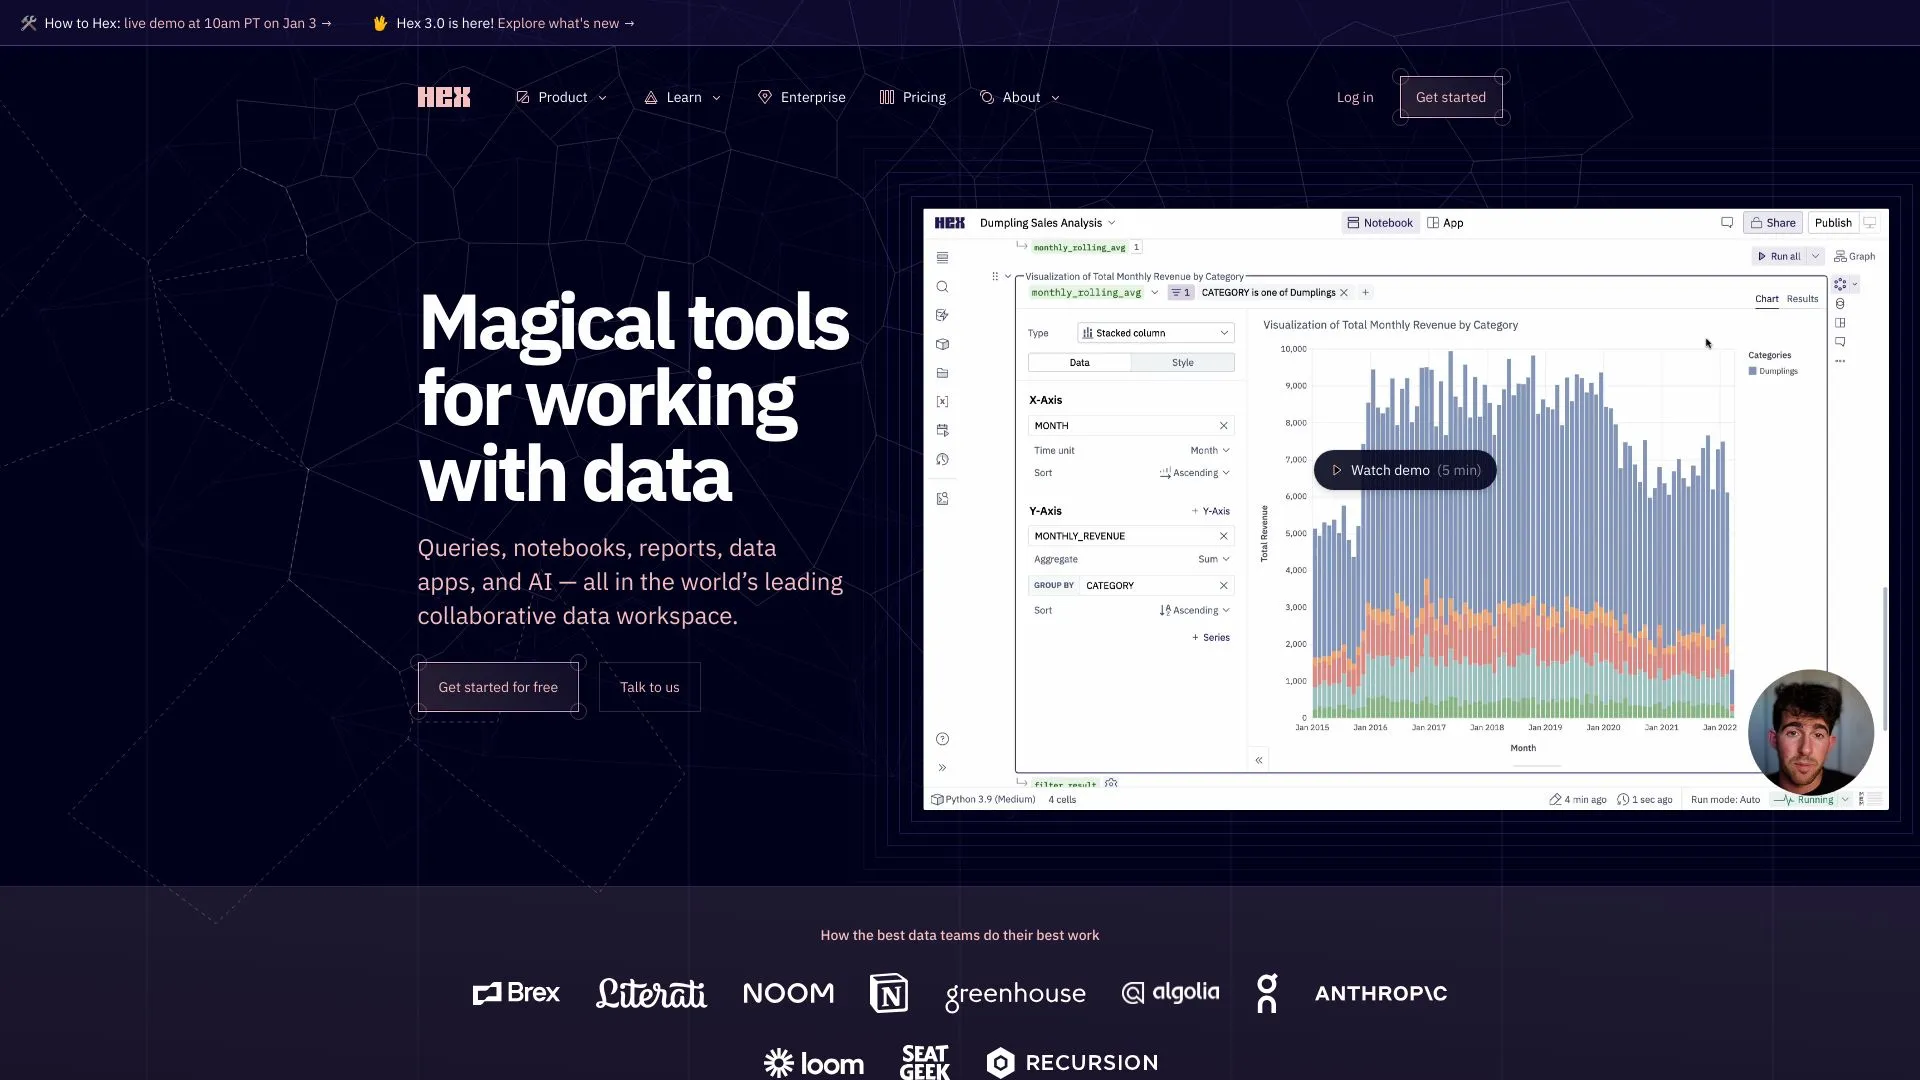
361.3K
5.0
Hex is an innovative platform designed to empower creators and communities by facilitating the seamless integration of technology and creativity. It offers a unique environment where users can collaborate, share, and monetize their digital content. By combining user-friendly tools with advanced features, Hex aims to enhance the creative process, making it accessible to everyone, regardless of their technical expertise.At its core, Hex promotes a decentralized approach to content creation, allowing individuals to connect with their audiences in meaningful ways. The platform emphasizes the importance of community engagement, enabling creators to build personal connections and foster loyalty among their followers. With a focus on collaboration and innovation, Hex is redefining the landscape of digital content creation and distribution.
AI Charting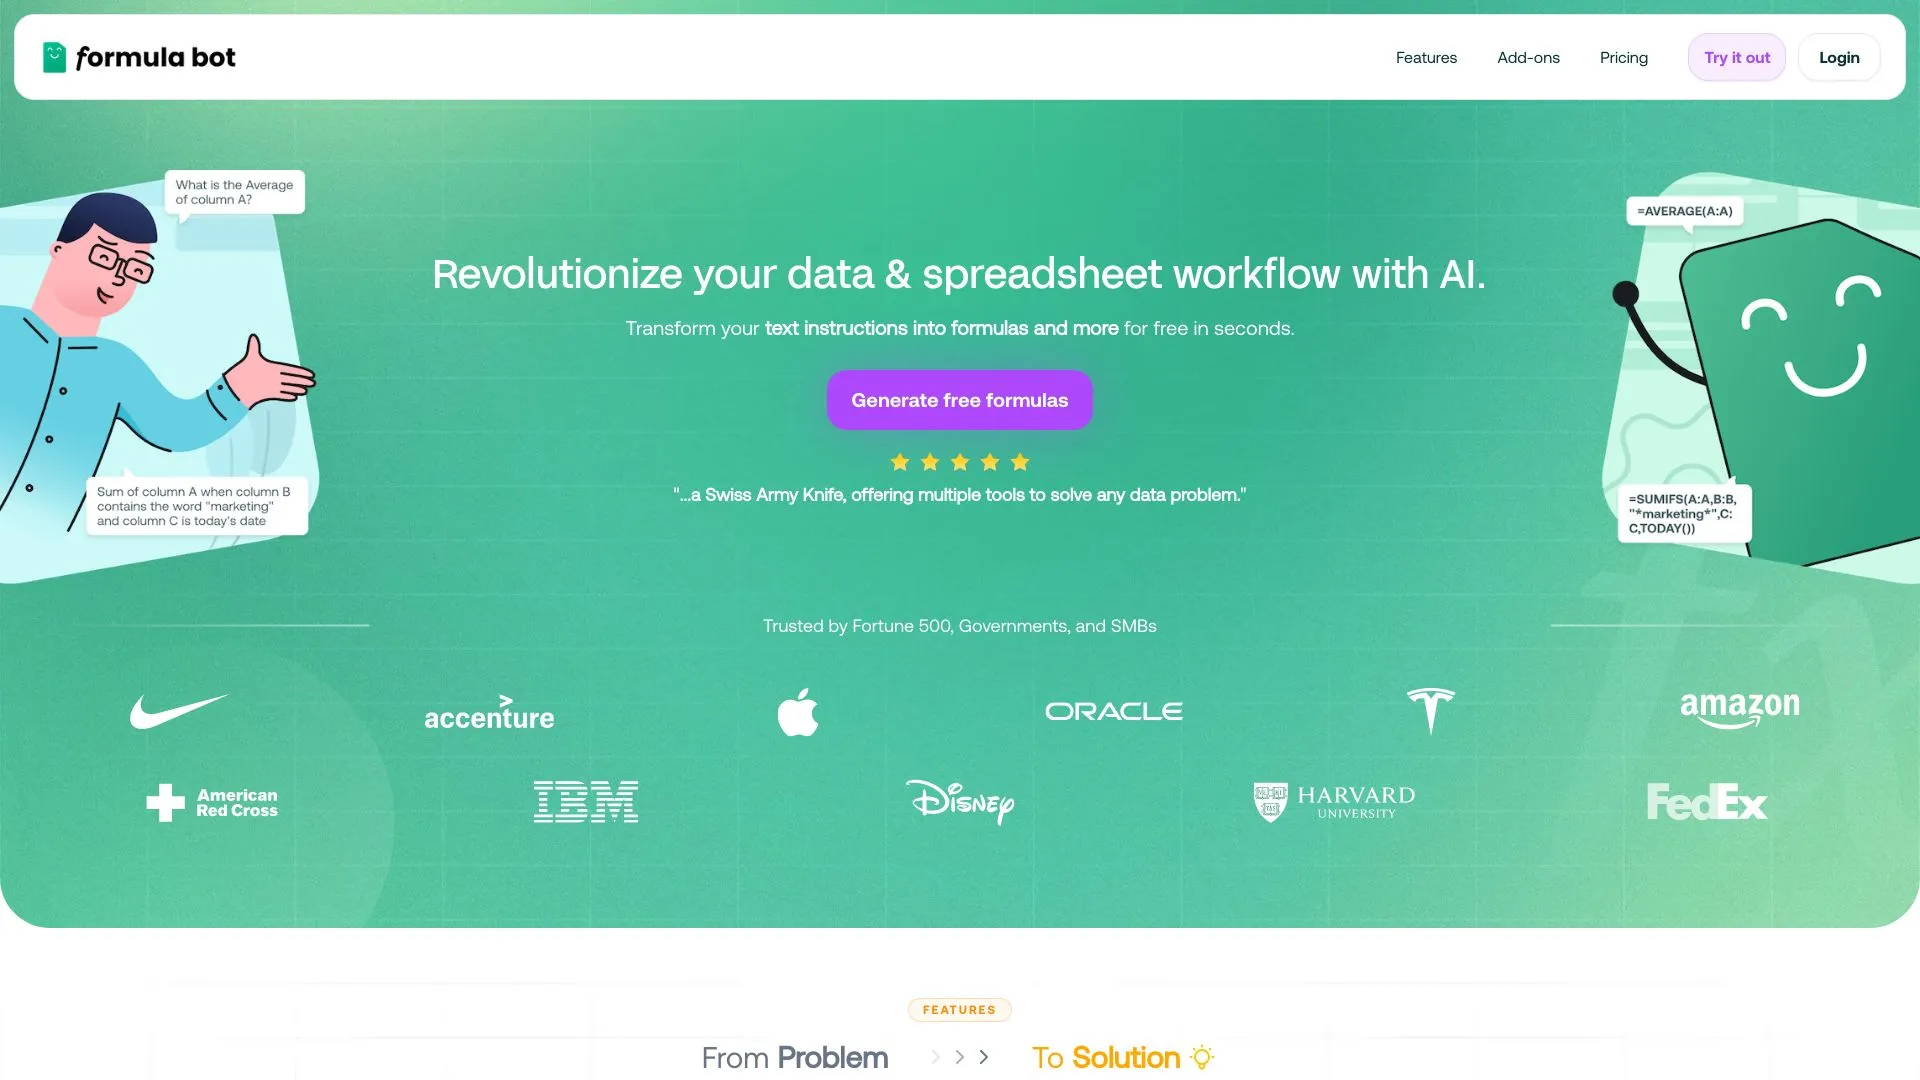
273.7K
4.7
Excel Formula Bot is an innovative tool designed to simplify the process of creating complex Excel formulas. By leveraging advanced AI technology, this bot assists users in generating accurate formulas quickly, allowing both beginners and seasoned Excel users to enhance their productivity. With its user-friendly interface, the bot takes the guesswork out of formula crafting, enabling users to focus on analyzing data rather than struggling with syntax.The platform caters to a wide range of Excel needs, from basic calculations to intricate data analysis tasks. Users can input their requirements in natural language, and the bot translates these into functional Excel formulas. This not only saves time but also reduces errors, making it an invaluable resource for anyone looking to streamline their spreadsheet tasks and improve their overall efficiency in Excel.
AI Charting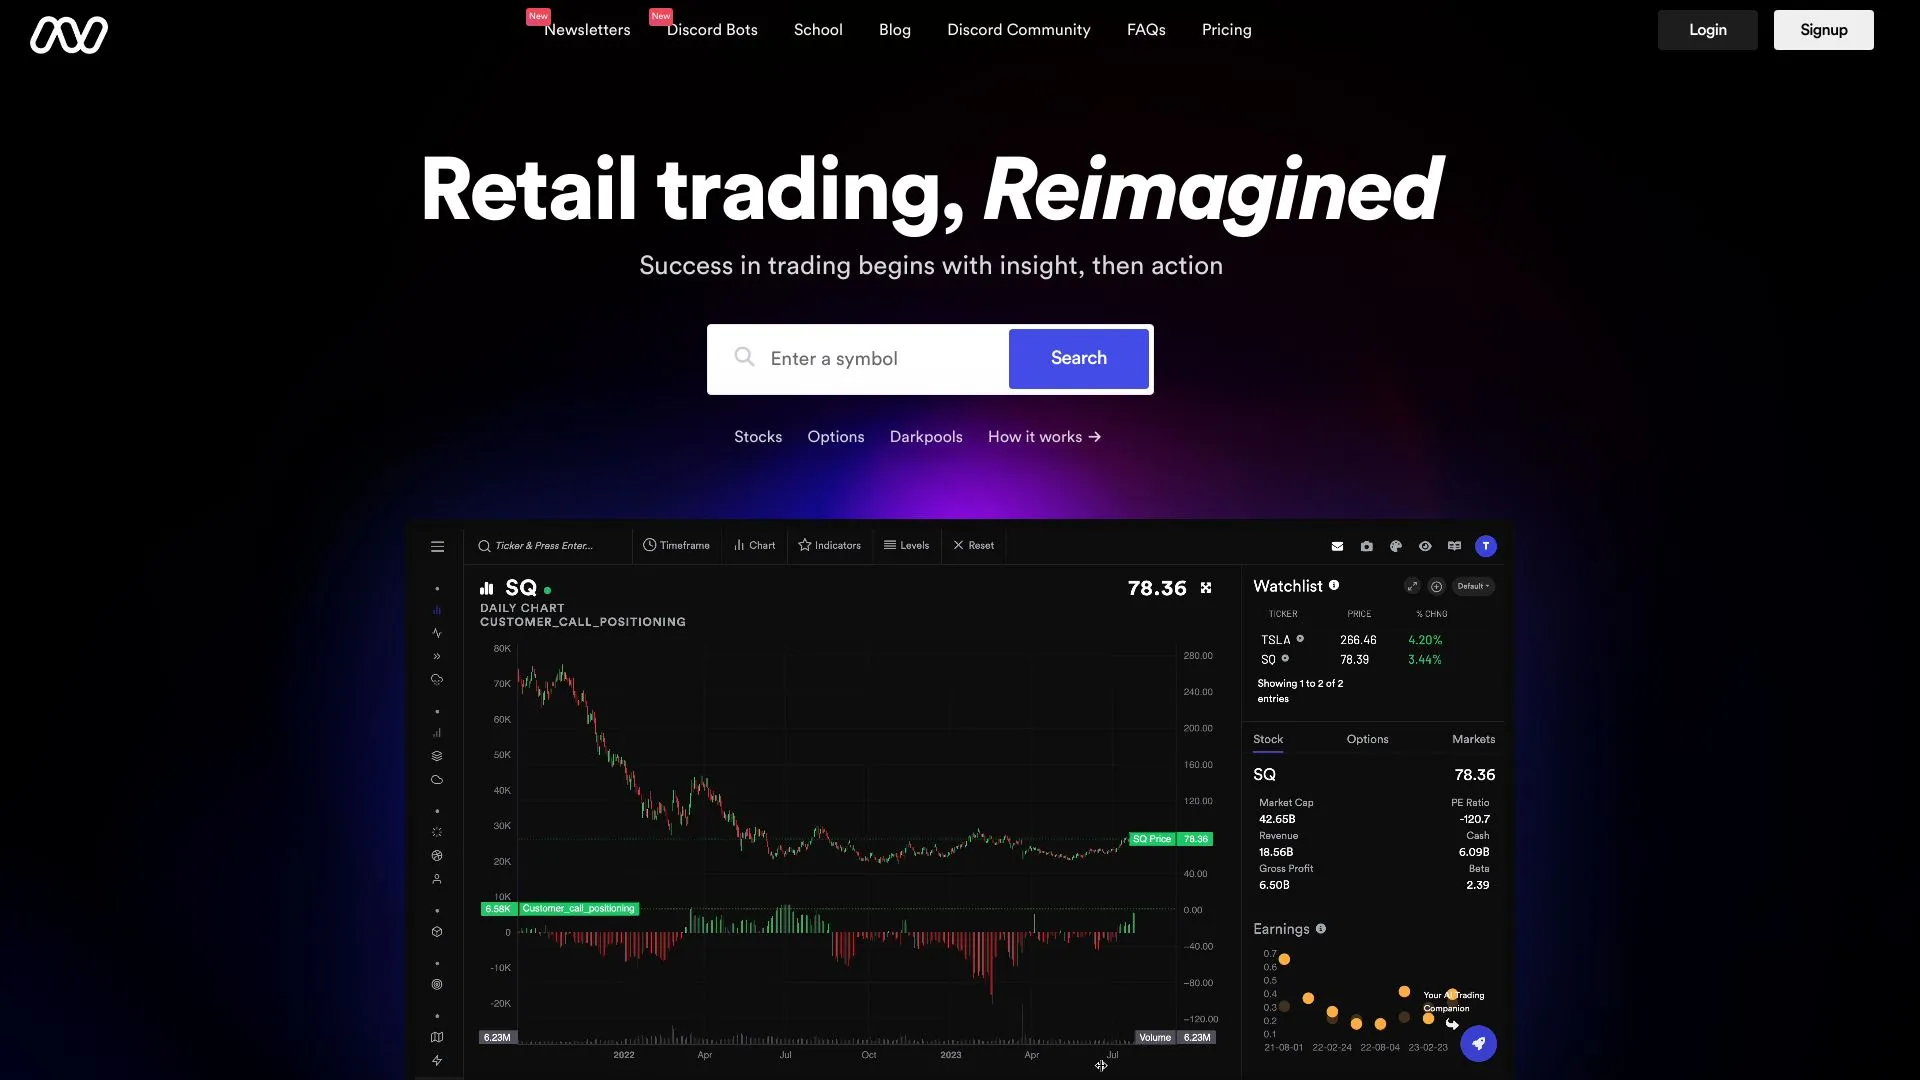
178.0K
4.5
Tradytics is a cutting-edge platform designed to empower traders and investors with advanced analytics and data-driven insights. By leveraging sophisticated algorithms and machine learning techniques, Tradytics aims to simplify the trading process and enhance decision-making. The platform offers a range of tools, including stock market analysis, options trading strategies, and sentiment analysis, all tailored to meet the needs of both novice and experienced traders.With a user-friendly interface and real-time data, Tradytics enables users to track market trends and make informed investment choices. The platform emphasizes community engagement, allowing users to share insights and strategies, fostering a collaborative trading environment. By combining technology and social trading elements, Tradytics seeks to revolutionize the way individuals approach the financial markets, making sophisticated trading strategies accessible to everyone.
AI Charting
